

Political violence is very irregularly distributed across time. Periods of relative calm are often followed by massive waves of attacks. Violent events are relatively rare, sparse and concentrated, making it difficult to evaluate whether violence is actually increasing or decreasing.
A novel approach to political violence
A new dashboard implemented by the OECD’s Mapping Territorial Transformation in Africa platform overcomes these limitations. Developed by Dr. Rafael Prieto-Curiel from the Complexity Science Hub and Dr. Olivier Walther from the University of Florida, the tool detects trends and shocks in violence that would not necessarily be visible using other methods.
This novel approach models the cumulative distribution of low-frequency events associated with certain extremist groups, regions, or countries in West Africa. Changes in the gradient of the cumulative curve of events corresponds to major temporal shocks, independently of how rare, sparse and concentrated violent events are.
As Dr. Prieto-Curiel explains “For events with very low frequency, many statistical analyses struggle to detect meaningful variations. If a city typically experiences one violent incident per week, for example, an increase to two incidents in a given week may not necessarily be unexpected or indicative of a significant trend”.
Monitoring hotspots of violence
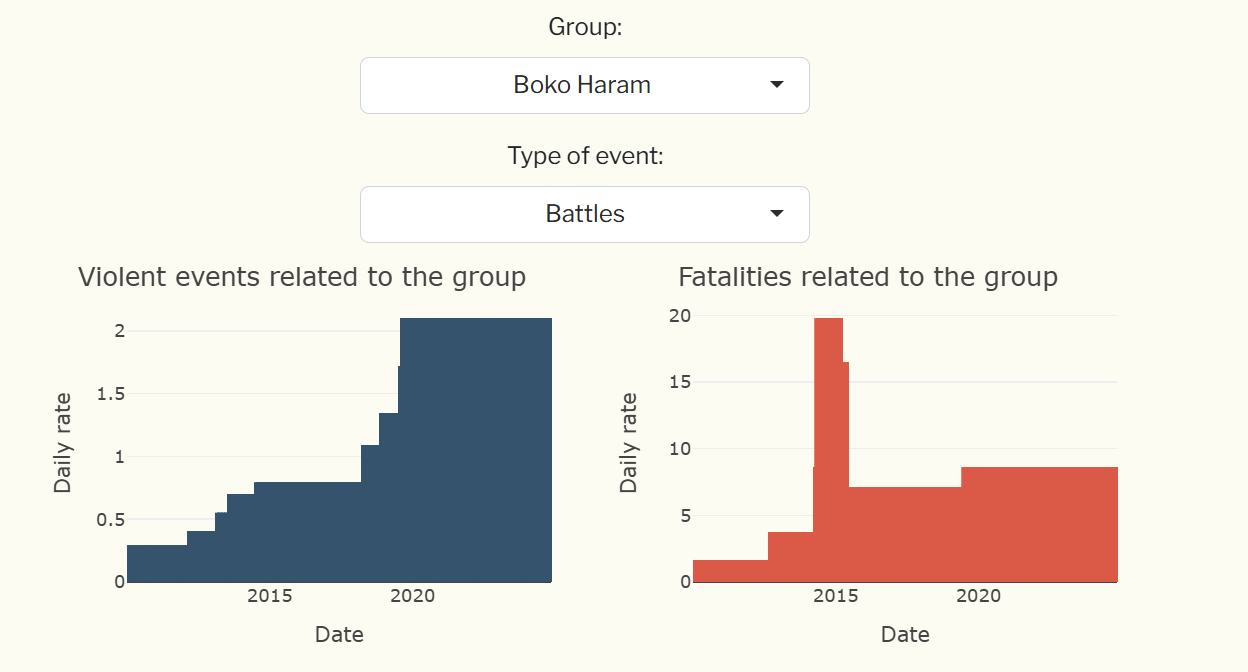
The new tool focuses on the Central Sahel and the Lake Chad basin, two regions where political violence has surged since the late 2000s. Using disaggregated data from the Armed Conflict Location and Event Data (ACLED) project, the dashboard identifies breaking points in the time series associated with Jihadist groups affiliated with Al Qaeda and the Islamic State.
In northern Nigeria, the tool shows for example that the last major shock occurred in 2019 after the military concentrated its forces in fortified camps and insurgents regained power in the countryside.
This new tool provides a better understanding of the evolution of the security crises affecting West Africa. As Dr. Walther, who runs the African Networks Lab at the University of Florida, explains: “The dashboard can tell us whether violence is increasing or decreasing in a particular region with a very high degree of precision. We can also track the evolution of certain extremist groups and how they respond to anti-insurgency initiatives”.
A new policy tool
The dashboard was developed in close collaboration with policy makers. It makes it possible to identify the populations most likely to suffer the consequences of political violence. “The last two years have been the deadliest on record in the Sahel, with 14,000 people killed from Senegal to Chad” explains Dr. Marie Trémolières, who coordinated the project at the OECD. “A third of these victims are civilians and it is crucial to know whether they will be more or less affected”, says Dr. Trémolières, highlighting the importance of this work.
For more information, contact Dr. Olivier Walther.